
Bitcoin’s Glass Ceiling: Understanding Resistance as Democrats Seize the US Congress
سقف شیشهای بیتکوین؛ درک مفهوم «مقاومت» همزمان با تسلط دموکراتها بر کنگره آمریکا
As the US Midterms deliver a 'Blue Wave' to Washington, Bitcoin is battling a critical technical resistance level near $78,000. Learn how political shifts in D.C. and technical indicators like the SMA(50) determine whether your portfolio grows or stagnates.
At time of publishing
USD
268,900
Toman
Gold 18K
25.86M
Toman / gram
Bitcoin
$78,292
US Dollar
Tether
269,039
Toman
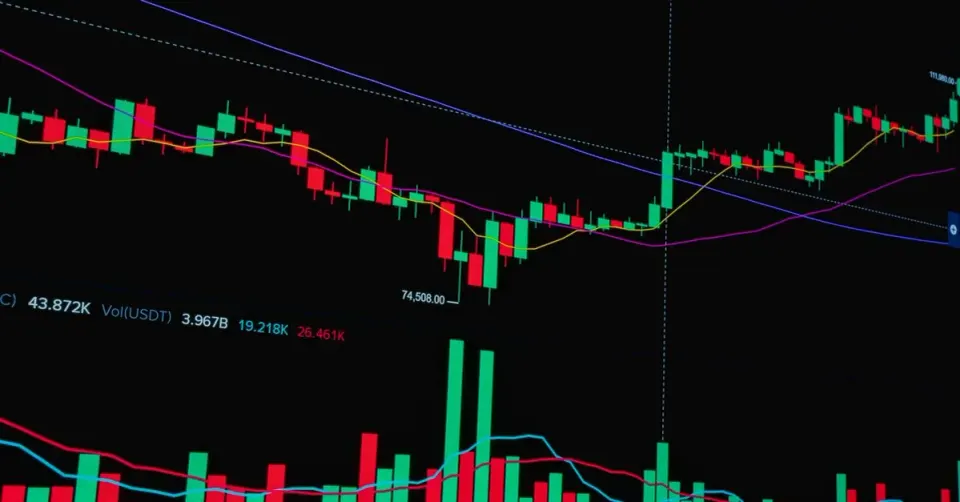
The financial world woke up today, Wednesday, November 4, 2026, to a transformed political landscape in the United States. With Democrats securing control of both the House and the Senate, the regulatory future for digital assets has entered a new chapter. For Iranian investors, this isn't just 'foreign news.' The 'Blue Wave' in Washington directly impacts the CLARITY Act and the future of stablecoin regulation, which in turn dictates the liquidity of USDT—the lifeline of many local traders. While the political dust settles, Bitcoin is currently testing its 50-day Simple Moving Average (SMA) resistance within a descending channel. But what does that actually mean for the average person holding Satoshi’s coins?
Think of a 'resistance level' like a glass ceiling in a crowded room. Every time the price of Bitcoin tries to jump higher, it hits this invisible barrier where sellers are waiting to dump their holdings, pushing the price back down. Today, Bitcoin is hovering at $78,292, attempting to break through the SMA(50). The SMA(50) is simply the average price of Bitcoin over the last 50 days. When the current price is below this average, the market is technically in a 'bearish' or pessimistic mood. Breaking above it would be a signal that the 'average' sentiment is turning optimistic again. If the price fails to break this ceiling, we might see it slide back toward the bottom of its current descending channel.
---
The Noise vs. The Signal
On a day like today, the news is flooded with headlines that can distract an investor. In Iran, the Minister of Education, Alireza Kazemi, spoke at the Aban 13 rallies, emphasizing the role of students in fighting 'Global Arrogance.' While these events shape the local political atmosphere, the currency market showed a surprising trend: the USD/IRR actually dropped by 0.9%, falling from 271,400 to 268,900 Toman. This suggests that the market had already 'priced in' the political rhetoric of the day. Meanwhile, in the global arena, stories like the induction of songs into the Australian National Songbook or the legal trials of journalists in Sydney provide cultural context but serve as 'noise' for a serious trader. The real 'signal' lies in the US Senate's shift, where figures like Sherrod Brown have reclaimed seats, potentially altering the speed of crypto adoption.
Understanding the difference between noise and signal is crucial for wealth preservation. For instance, while mainstream media focuses on political speeches, savvy users are looking at technology trends. Ethereum researchers are now targeting 2028 for 'quantum resistance,' ensuring that even the most powerful future computers won't be able to crack your digital wallet. This kind of long-term technical planning is what gives an asset fundamental value, regardless of who wins an election in Georgia or Florida. Even the rise of AI-driven promo tools, like those seen for Columbia or Hoka gear, reflects a broader shift toward an automated digital economy that investors must navigate.
---
Why Your Strategy Must Adapt
With Gold 18k rising 1.6% today to 25,855,302 Toman per gram, we see a classic 'flight to safety.' When political uncertainty hits—like a change in US Congressional leadership—investors often hedge their bets by moving into gold. The Emami coin also rose 1.0% to reach 264,000,000 Toman. This divergence between a falling Dollar and rising Gold suggests that local demand for 'hard assets' remains high, even as the currency fluctuates. As a reader of Arzbin, your goal should be to balance these technical indicators (like Bitcoin's SMA) with macro-political reality.
In the coming weeks, watch the 'CLARITY Act' closely. If the new Democratic majority moves toward strict stablecoin oversight, the 'peg' of USDT might face new pressures. Conversely, if they embrace the technology to compete with China’s clean energy and digital dominance, we could see a massive breakout in crypto prices. Remember, the market doesn't move on facts alone; it moves on how people expect those facts to change the future. Whether you are looking at a candlestick chart or a news ticker, always ask: is this a temporary barrier (resistance), or a fundamental shift in the floor beneath my feet?
Concept Diagram
Frequently Asked Questions
Why did USD fall while Gold rose in the Iranian market today?
What is the significance of the SMA(50) for Bitcoin right now?
How does the US Democratic victory affect Iranian crypto users?
What does 'Quantum Resistance' mean for my Ethereum holdings?
Understanding Resistance: The 'Glass Ceiling' in Financial Markets
In financial markets, whether for Bitcoin, stocks, or commodities, understanding the concept of Resistance is crucial for interpreting price movements. Often described as a "glass ceiling," resistance is a price level where upward price movement is halted or reversed due to a concentration of selling interest. This occurs because, at this specific price point, a significant number of investors are willing to sell, creating an imbalance where selling pressure temporarily overwhelms buying pressure. This phenomenon prevents prices from rising further, at least until demand strengthens enough to absorb the available supply.
Resistance levels typically form around previous highs, where investors who bought at those levels might look to sell to break even, or those who bought lower might take profits. This psychological dynamic creates a supply zone. For instance, if Bitcoin previously reached $70,000 and then fell, many holders who bought near $70,000 might place sell orders there, creating a strong resistance level when the price approaches it again. Technical analysts identify these levels using historical price data, looking for points where the asset struggled to advance.
Various tools are employed in technical analysis to pinpoint these crucial levels. Beyond simply observing past price peaks, indicators like moving averages can act as dynamic resistance. For example, the 50-day Simple Moving Average (SMA 50) is often watched closely; if an asset's price is trending below its SMA 50, this moving average can act as a resistance level, indicating that the short-term trend is bearish and selling pressure is likely to emerge as the price attempts to cross above it. Chart patterns such as trendlines and Fibonacci retracement levels also help in identifying potential areas of resistance.
For investors and traders, recognizing resistance levels is vital for making informed decisions. It helps in setting realistic price targets, identifying potential entry or exit points, and managing risk by placing stop-loss orders. When an asset approaches a strong resistance level, traders might anticipate a pullback and consider taking profits or avoiding new purchases. Conversely, a decisive break above a significant resistance level, especially on high volume, is often seen as a bullish signal, indicating that buying pressure has overcome selling pressure and the asset may be poised for further gains. In such cases, the broken resistance level often transforms into a new support level, reinforcing the upward trend.