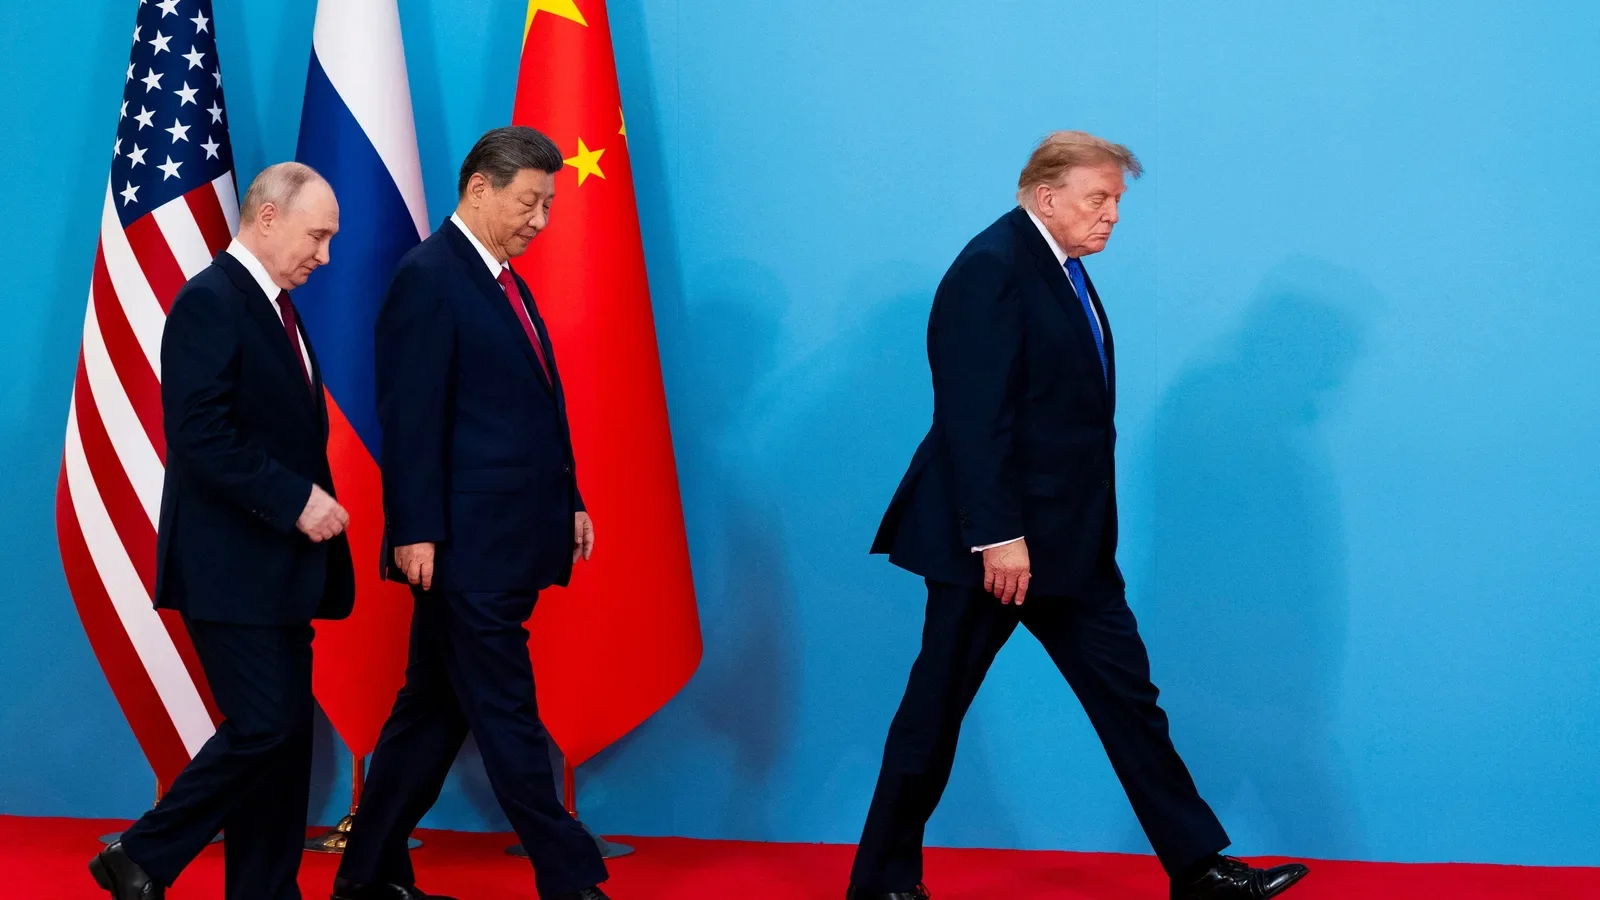
Trump, Xi, and Putin’s Summit Stalls as USD Pierces 270k and Bitcoin Hits Bearish ‘Death Cross’
بنبست دیپلماتیک در شنژن همزمان با عبور دلار از مرز ۲۷۰ هزار تومان و سقوط بیتکوین
A highly anticipated trilateral summit between the US, China, and Russia ended with symbolic gestures but no major breakthroughs on Ukraine or AI. Meanwhile, the Iranian Toman hit a new low as the Dollar surpassed 270,000, and Bitcoin entered a technical 'death cross' pattern.
At time of publishing
USD
270,700
Toman
Gold 18K
24.23M
Toman / gram
Bitcoin
$62,540
US Dollar
Tether
272,106
Toman
The Shenzhen Summit: Symbolic Warmth, Strategic Stalemate
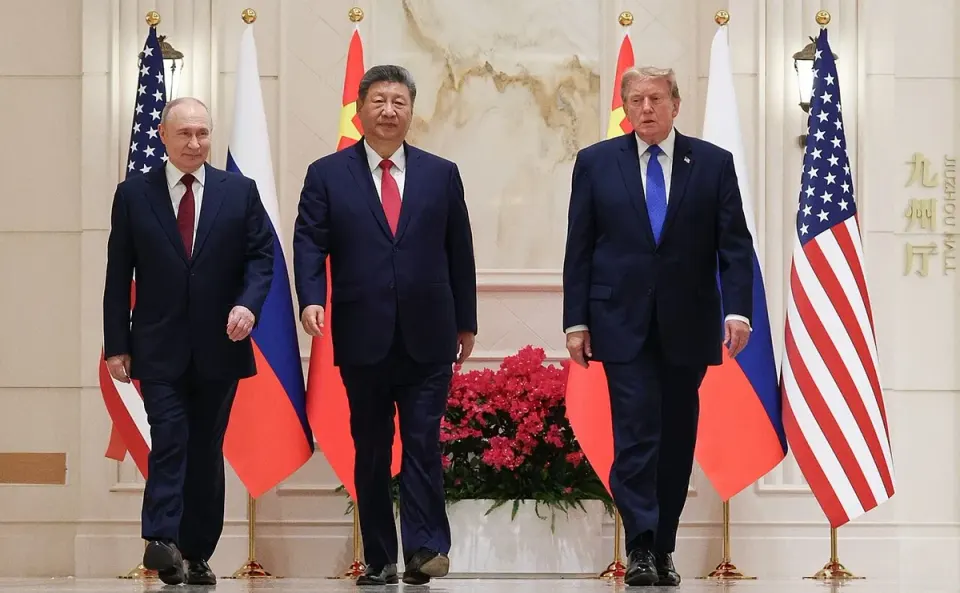
The historic trilateral summit in China between President Trump, Xi Jinping, and Vladimir Putin has concluded with a flurry of symbolic gestures but a glaring lack of policy breakthroughs. While Trump touted his "camaraderie" with the Russian and Chinese leaders, calling Putin a "friend" and praising the warm welcome in China, the substance of the talks failed to address the world's most pressing crises. No agreements were reached regarding nuclear arms control, the regulation of generative AI, or a path toward ending the war in Ukraine. In fact, moments after the summit concluded, Putin stated that Russia would not negotiate a ceasefire, effectively silencing the optimism Trump had attempted to project.
However, the three powers did find common ground on one critical front: global energy stability. Amid the ongoing regional conflict often referred to as the "Iran war," which has caused a massive spike in global oil prices, the U.S., China, and Russia agreed to increase the supply of refined petroleum products. This move is a pragmatic response to the energy transition's volatility and the immediate threat of supply chain collapses. For the global economy, this pact serves as a temporary relief valve, though it highlights the deep-seated instability that continues to drive market anxiety across the Middle East and beyond.
Tehran Markets: USD Pierces 270,000 as Gold Diverges
At 23:00 Tehran time on Thursday, November 19, 2026, the Iranian currency market is grappling with a significant psychological breach. The US Dollar rose from 266,300 to 270,700 Toman, marking a 1.7% increase in just 24 hours. This surge past the 270k barrier reflects the market's skepticism toward the recent diplomatic posturing in Shenzhen and the persistent fears of regional escalation. While the dollar climbed, Gold 18k per gram saw a slight retreat, moving from 24,470,197 to 24,232,420 Toman (-1.0%). This divergence suggests that while the currency is under intense pressure, some domestic investors may be rotating assets or facing liquidity constraints as the cost of living continues to accelerate.
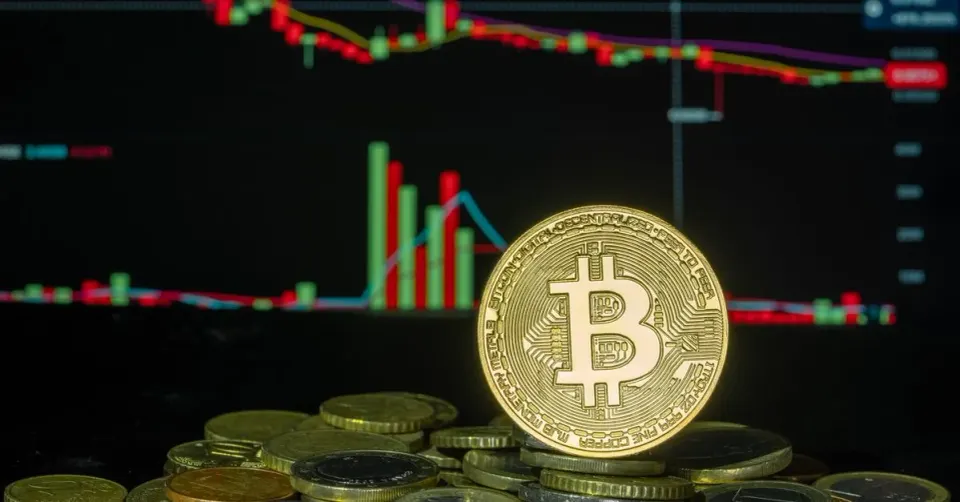
In the cryptocurrency space, the mood is equally somber. Bitcoin has officially entered a "death cross" on its daily chart—a technical pattern where the short-term moving average crosses below the long-term average, often signaling further downside. Despite the high-profile Nasdaq debut of AI lab Anthropic, which saw shares hit $115 before dipping below $100, Bitcoin failed to find a catalyst for a rally. The premier cryptocurrency dropped toward $62,540, ignoring the tech sector's excitement as broader macroeconomic fears and the strengthening dollar weighed heavily on risk assets.
Musk’s Pivot and the Changing Corporate Guard
In a surprising post-midterm move, Tesla CEO Elon Musk has begun making peace offerings to the Democratic party. After spending hundreds of millions to support Republican candidates, Musk recently admitted that he might have overspent and expressed a desire to "rewind the clock." This shift is seen as a strategic hedge as the tech industry faces a divided government and shifting regulatory priorities. Musk’s move follows a broader trend of tech billionaires attempting to mitigate political risk by diversifying their allegiances, especially as the U.S. economy shows surprising signs of resilience with more room for growth despite high interest rates.
Meanwhile, in Iran, the religious and social landscape saw a moment of high-level convergence. A memorial service for the late Grand Ayatollah Hossein Vahid Khorasani was held at the Razavi Holy Shrine, an event organized by the office of the Leader. The ceremony, attended by high-ranking religious figures, underscores the state's efforts to maintain internal cohesion and honor traditional clerical hierarchies during a period of intense external pressure and economic hardship. This internal stability remains a core focus for the government even as international markets focus on the country's geopolitical role.

Tech Updates: Steam Machine and the AI Dilemma
On the technology front, Valve has finally removed the waitlist for its 512GB Steam Machine, allowing consumers to purchase the hardware directly. However, the company warned of potential future supply issues due to a global RAM shortage, dubbed "RAMaggedon." This supply chain constraint mirrors the broader challenges facing the tech sector, where even as AI models like Anthropic's Claude gain massive valuations, the physical infrastructure required to run them remains vulnerable to geopolitical shocks and resource scarcity.
Furthermore, new research into Large Language Models (LLMs) has revealed a persistent flaw: models are increasingly likely to provide incorrect climate information if prompted with leading questions. This "hallucination" problem highlights the danger of relying on AI for critical scientific data, even as the industry pushes for trillion-dollar valuations. As AI becomes more integrated into financial and political decision-making, these technical shortcomings represent a significant risk factor that markets have yet to fully price in.
Frequently Asked Questions
چرا قیمت دلار در بازار تهران افزایش یافت؟
منظور از «تقاطع مرگ» در نمودار بیتکوین چیست؟
خروجی نشست ترامپ، پوتین و شی جینپینگ چه بود؟
Understanding the ‘Death Cross’ in Bitcoin Technical Analysis
The death cross is a chart‑pattern used in technical analysis that occurs when a short‑term moving average, typically the 50‑day simple moving average (SMA), drops below a longer‑term moving average, most often the 200‑day SMA. This crossover is interpreted by many traders as a bearish signal, suggesting that momentum has shifted from buyers to sellers and that a further price decline may follow. While the pattern originated in equity markets, it has become a staple in the analysis of cryptocurrencies, especially Bitcoin, whose price charts are closely watched by both retail and institutional investors.
In practice, the death cross is not a guarantee of a crash; it merely reflects a change in the trend’s slope. The signal can be noisy in volatile markets, and false positives are common. Analysts therefore combine the death cross with other indicators—such as volume trends, relative strength index (RSI), or on‑balance volume—to increase confidence. For Bitcoin, the pattern gained notoriety in late 2023 and again in 2026 when the cryptocurrency’s price fell sharply after a prolonged rally, prompting headlines that linked the crossover to a “bearish death cross.”
Why does the death cross matter for Bitcoin? Unlike traditional assets, Bitcoin trades 24/7 across a global network of exchanges, making its price highly sensitive to macro‑economic shocks, regulatory news, and market sentiment. A death cross can amplify fear among traders, leading to accelerated selling and liquidity squeezes. Conversely, some investors view the pattern as a buying opportunity, betting that the market has overreacted and that a reversal will follow the oversold condition.
It is also important to recognize the psychological component. The term “death cross” itself carries a dramatic connotation that can influence market participants’ expectations, creating a self‑fulfilling prophecy. Understanding the statistical performance of the pattern—studies show mixed results, with the death cross correctly predicting a downtrend roughly 60‑70% of the time in equities—helps investors avoid overreliance on a single signal.
In summary, the death cross is a simple yet powerful tool in the technical analyst’s toolbox. When applied to Bitcoin, it should be interpreted within the broader context of market fundamentals, sentiment, and complementary technical indicators. By appreciating both its strengths and limitations, traders can make more informed decisions rather than reacting purely to headline‑driven panic.
Topics
Related Articles