
Yemen Tensions Flare as Oil Markets Bet on Diplomacy; Bitcoin Signals Major Bull Run
تنشهای یمن و قمار نفت روی دیپلماسی؛ بیتکوین در آستانه رالی بزرگ
As Houthi forces push for new territory in Yemen, global oil markets are paradoxically sliding on hopes of a diplomatic breakthrough at the UN. Meanwhile, Bitcoin has cleared a critical technical hurdle that historically triggers massive bull markets.
At time of publishing
USD
230,800
Toman
Gold 18K
23.87M
Toman / gram
Bitcoin
$81,523
US Dollar
Tether
228,800
Toman
Market Open — Stability Amidst Regional Noise
The Tehran market opened this Monday with a sense of cautious stability. The US Dollar (USD/IRR) remained virtually unchanged, trading at 230,800 Toman, reflecting a 0.0% change over the last 24 hours. While the currency market seems to be holding its breath, gold has seen a slight correction. Gold 18k per gram dropped by 0.6%, falling from 24,008,495 to 23,869,984 Toman. This minor dip comes despite the global gold ounce hovering at a staggering $4,352.00, suggesting that local demand or currency expectations are currently buffering the impact of international metal prices.
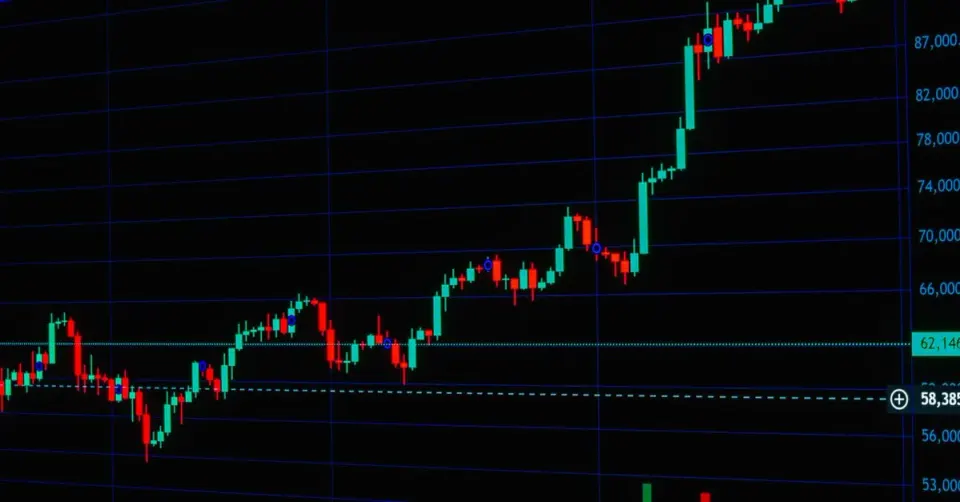
In the crypto space, the mood is decidedly more electric. Bitcoin (BTC) is trading at $81,523, maintaining its strength after clearing its 50-week moving average for the first time in nearly a year—a technical signal that has historically preceded the most aggressive bull runs in the asset's history. For the Iranian trader, this means the 'digital gold' is currently outperforming traditional hedges, even as the Tether (USDT) rate sits at 228,800 Toman, slightly below the physical dollar rate, indicating a healthy but not yet euphoric local demand for crypto liquidity.
Houthis Push for Territory as Regional Tensions Surge
Overnight reports from Yemen indicate a significant escalation in the long-standing conflict. The Iranian-backed Houthi militia has launched a series of offensives aimed at expanding their territorial control, engaging in fierce battles with Saudi-backed government forces. This move comes at a sensitive time when regional powers were supposedly exploring de-escalation. The push to gain ground suggests that the militia is looking to strengthen its hand before any potential high-level negotiations, or perhaps signaling that they are not bound by the diplomatic whispers currently circulating in Western capitals.

This escalation is more than just a local skirmish; it directly threatens the stability of the Bab el-Mandeb strait, a critical chokepoint for global trade. For Iran, the geopolitical stakes are high. Any intensification of the proxy war with Saudi Arabia usually puts upward pressure on the 'risk premium' for the Toman. While the currency remained flat this morning, a prolonged conflict in Yemen often acts as a leading indicator for market volatility in Tehran, as it complicates the path toward regional normalization and sanctions relief.
Oil Prices Slide on 'Diplomatic Betting' Despite Threats
In a move that surprised some analysts, crude oil prices started the week with a downward slide. Brent crude fell to approximately $102.05 per barrel, while WTI dropped toward $98.50. The driver behind this move isn't a sudden surplus of oil, but rather a speculative bet by traders. Despite fresh threats traded between Washington and Tehran over the weekend, markets are pinning their hopes on a UN meeting this week, searching for any sign of a 'diplomatic off-ramp' that could stabilize the Middle East and ease supply concerns.
This creates a fascinating paradox: while the ground reality in Yemen is heating up, the financial markets are pricing in peace. This 'diplomacy trade' is fragile. If the UN meetings fail to produce a concrete roadmap for de-escalation, or if the rhetoric from the US administration turns more hawkish, we could see a violent reversal in oil prices. For the Iranian economy, which remains heavily sensitive to oil revenue and the resulting foreign exchange inflows, this volatility is a double-edged sword. A lower oil price might ease global inflation, but it also tightens the budget constraints for a government already struggling with significant deficits.
Trump’s 'Secret' Deportation Deals and Global AI Safety
Away from the markets, a significant human and political story is unfolding regarding US immigration policy. Reports have surfaced of 'shadowy deals' made by the Trump administration to deport migrants to third countries in Africa and Latin America. Notably, an investigation highlighted the case of an Iranian woman who was deported from the US to a country in Africa she didn't even know existed. These secret agreements represent a hardening of US borders that has direct implications for the Iranian diaspora and those seeking to move capital or family members to the West.

On the technology front, the US and China are reportedly discussing an 'AI safety plan' ahead of a high-stakes summit between Trump and Xi Jinping. This is a rare area of cooperation in an otherwise competitive relationship. While Nvidia’s CEO Jensen Huang has dismissed 'doomsday' AI narratives as exaggerated, the fact that the world's two superpowers are sitting down to discuss the guardrails of artificial intelligence suggests that the economic and military implications of AI are now a top-tier geopolitical priority. For investors, this signals that while the 'AI hype' might be cooling, the structural integration of AI into global governance is just beginning.
Frequently Asked Questions
چرا قیمت نفت با وجود جنگ در یمن کاهش یافته است؟
سیگنال ۵۰ هفتهای بیتکوین چه اهمیتی برای سرمایهگذاران دارد؟
اخراج مهاجران به کشورهای ثالث چه تاثیری بر ایرانیان دارد؟
Understanding the 50‑Week Moving Average and Its Role in Bitcoin Bull Signals
The moving average (MA) is a statistical tool that smooths out price data by creating a constantly updated average price over a specified time window. Traders use it to filter out short‑term volatility and to highlight the underlying trend. While daily and 200‑day MAs are common, a 50‑week moving average looks at the average price over the past 50 weeks (approximately one year), providing a long‑term perspective that is less noisy than shorter windows.
In the context of Bitcoin, the 50‑week MA is especially valuable because the cryptocurrency’s price can swing dramatically within days. By anchoring the analysis to a yearly horizon, investors can see whether the market is in a sustained uptrend or downtrend. When Bitcoin’s price climbs above its 50‑week MA, many analysts interpret this as a bullish signal, suggesting that the asset has gathered enough momentum to break out of a longer‑term consolidation phase.
Historically, several notable Bitcoin rallies have been preceded by a cross‑over above the 50‑week MA. For example, in late 2020 the price moved above this level and continued to surge, eventually reaching the $60,000 milestone in early 2021. However, the indicator is not infallible; false breakouts can occur, especially when market sentiment is driven by external news such as geopolitical tensions or regulatory announcements. Therefore, prudent traders often combine the 50‑week MA with other tools—like volume analysis, relative strength index (RSI), or macro‑economic cues—to confirm the strength of the trend.
Understanding how the 50‑week moving average works equips investors with a simple yet powerful lens for evaluating Bitcoin’s long‑term health. It helps separate genuine trend shifts from short‑lived price spikes, allowing market participants to make more informed decisions about entry, exit, and risk management.